Hao VPS has written about some commonly used commands and components of Linux before. We use the VPS of Linux system and commonly use the top command to check the resource usage, including CPU, memory and process status. However, if we want to check the real-time traffic status and TCP connection, you can use the iftop tool.
iftop is a real-time traffic monitoring tool similar to top. However, it is not the same as top. You can see it by running the command directly. We also need to compile and install it first.
Compile and install iftop
iftop official website: http://www.ex-parrot.com/~pdw/iftop/
Currently, the latest version of iftop is 0.17. First, we need to install the dependency packages required by iftop.
Installation under CentOS:
yum install flex byacc libpcap ncurses ncurses-devel libpcap-devel
Installation under Debian:
apt-get install flex byacc libpcap0.8 libncurses5
Next, compile and install iftop
wget http://www.ex-parrot.com/pdw/iftop/download/iftop-0.17.tar.gz
tar zxvf iftop-0.17.tar.gz
cd iftop-0.17
./ configure
make && make install
Use iftop
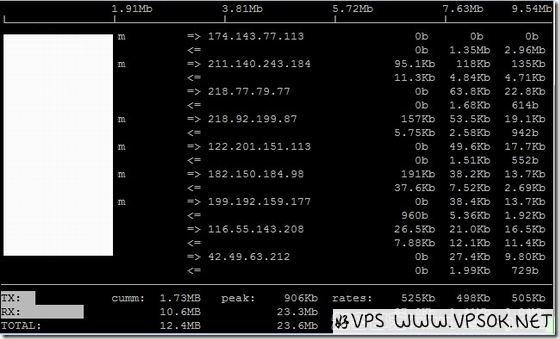
After compilation and installation, directly enter the command: iftop to run iftop. The interface is as follows:

=><= in the above figure indicates the direction of traffic (sending and receiving)
below TX represents the sending traffic, RX is equal to the receiving traffic, TOTAL summary, Cumm represents the total traffic since running iftop, peak represents the peak value, and rates represents the average traffic in the past 2s, 10s and 40s respectively.
Parameters and commands
The following iftop parameters and commands are quoted from Brother Jun: http://www.vpser.net/manage/iftop.html
Commonly used parameters
-i sets the monitored network card, such as: # iftop -i eth1
-B displays the traffic in bytes (the default is bits), such as: # iftop -B
-n causes the host information to be displayed directly by default IP, such as: # iftop -n
-N makes the port information directly display the port number by default, such as: # iftop -N
-F displays the incoming and outgoing traffic of a specific network segment, such as # iftop -F 10.10.1.0 /24 or # iftop -F 10.10.1.0/255.255.255.0
-h (display this message), help, display parameter information
-p After using this parameter, the local host information displayed in the middle list appears IP information other than the local machine;
-b causes the traffic graph bar to be displayed by default;
-f is used for filtering calculation packets;
-P causes host information and port information to be displayed by default;
-m sets the maximum value of the scale at the top of the interface. The scale is displayed in five segments, for example: # iftop -m 100M
Operation commands (note case)
Press h to switch whether to display the help;
Press n to switch to display the IP or host name of the local machine;
Press s to switch whether to display the host information of the local machine;
Press d to switch whether to display the host of the remote target host Information;
Press t to switch the display format to 2 lines/1 line/only send traffic/only receive traffic;
Press N to switch to display the port number or port service name;
Press S to switch whether to display this
Press D to toggle whether to display the port information of the remote target host;
Press p to toggle whether to display the port information;
Press P to toggle pause/continue display;
Press b to toggle whether Display the average traffic graphic bar;
Press B to switch to calculate the average traffic within 2 seconds, 10 seconds or 40 seconds;
Press T to switch whether to display the total traffic of each connection;
Press l to open the screen filtering function , enter the characters to be filtered, such as ip, and after pressing Enter, the screen will only display the traffic information related to this IP;
Press L to switch the scale on the top of the display screen; with different scales, the traffic graph bar will change;
Press j or k to scroll up or down the connection records displayed on the screen;
Press 1 or 2 or 3 to sort according to the three columns of traffic data displayed on the right;
Press < according to the local unit on the left Sort by name or IP;
Press > to sort by the host name or IP of the remote target host;
Press o to switch whether to display only the current connection;
Press f to edit the filter code, which is translated argument, I haven’t used this yet!
Press ! to use shell commands.
Press q to exit monitoring.

